

How to Create a Project Plan the Right Way
Francesco Marcatto28 Jul 19
Table of contents
“Talent wins games, but intelligence and teamwork wins championships” – Michael Jordan
The role of the Project Manager is somewhat similar to the coach of a high-level basketball team: they both have to bring order and organization to a group of (more or less) talented and skilled people. Indeed, success doesn’t happen by accident. MJ got it right: teamwork and organization are key elements for reaching success.
Instead of training sessions and schemes, PMs use project plans to guide their teams towards their goal. In a nutshell, the project plan is some sort of document that contains everything needed for guiding the execution and control of the project.
There are many resources at our disposal to create a project plan, however, without the proper foundation, any plan will come tumbling down. For example, many people think they could cut corners by creating their plan directly into Gantt charts, however, we should remember that Henry Gantt didn’t create the timeline chart for the sake of planning, but rather to display and communicate an already developed schedule.
Here we’ll see the steps for creating a sound, solid project plan.
Start with Goals and Scopes
Before we can manage any project successfully, we need to understand two fundamental elements: Why and What.
In the PM lingo, the why and the what are referred to as Goals (why) and Project Scopes (what). The Goal lets us know the motivation behind the tasks ahead, whereas the project scope tells us what must be done.
Thus, it’s of vital importance to accurately identify these two elements. If you get these wrong, the projected results would in most cases fall short of the estimations.
Work Breakdown Structure
Once we have firmly understood the project goals and scopes, we can move on to create a plan on how to achieve those goals within the scope.
The main essence of a Project Plan is that it’s made up of subordinate plans that explain how we will manage project decisions and leadership dynamics. It will dictate everything from resource allocation, team dynamics, scheduling, finances and many other activities that might arise.
Many experienced PMs do this by creating a sequence of high-level tasks (also called work packages, main activities, or epics) which breaks down the project into smaller, more manageable pieces.
Then, break down further these high-level tasks into smaller, meaningful tasks. Which is the right level of detail? There is no right answer here, so we suggest to use an “if it makes sense” heuristic. In the words of the “Practicing IT Project Manager” Dave Gordon, “Make your structure as detailed as needed to facilitate an understanding of the work, but not so detailed that it becomes unmaintainable”.
This will also help paint a clearer picture of the sequencing of tasks. In other words, which tasks will be required to be completed prior to moving onto the next set of tasks.
When we have explored all of these elements, we can understand what skills are necessary and so what resources will be required to complete the tasks.
Resources
Once we have established the work breakdown structure, we can start focusing on who would be most adequate to complete each task based on their skills and availability. In many cases, there might be overlapping skillsets, meaning that team members can overlap in certain areas.
In some cases, the shared responsibility might be delegated to something non-human, such as a server or platform as opposed to a human participant. For instance, if one were to integrate an automated CRM platform into the workflow, many of the communications would be the responsibility of the CRM itself, as opposed to a coworker.
Time Estimations and Scheduling
Once you know what should be done and the resources involved, you can start estimating how long it will take to complete each task.
The intrinsic difficulty here is that we are usually over-optimistic in providing estimates (the well-known planning fallacy), and this is one of the major complaints from team members, which in turn can create a high-stress environment that could affect productivity negatively.
A more formal way to estimate accurately consists in analyzing the complexity of each task and creating three estimations on the time it will take to complete the task.
- Optimistic Time Estimation (O)
- Normal Time Estimation (M)
- Pessimistic Time Estimation (P)
Utilizing these three variables, you can calculate the “Expected Time” (TE) using beta probability distribution using the formula: (O + 4M + P) ÷ 6.
Of course, when we’re talking about complex tasks with multiple variables, these calculations can become difficult. Additionally, if there are “dependent” variables in play or tasks that need to be required first in order to move onto other tasks, it can be extremely hard to calculate.
Nonetheless, it is also important to understand that estimates are subject to change based on the execution of the tasks. If, for some reason, there is a delay on a task that affects another, it’s obvious that there will have to be an adjustment to the timeframe required to execute the task.
In order to do this properly, you will have to utilize all of your critical thinking faculties in conjunction with proper modelling and specificity in relation to the assumptions made. It’s not a job for everyone, and can be a nightmare for those underqualified to do this.
It’s Timeline Time!
Now that we have accumulated all of the data necessary within our project plan, we can create the schedule. It’s important to take into consideration weekends, holidays, and any other conflicts that might arise. Additionally, it’s necessary to consider task dependencies, confidence in the resources (will they meet the deadlines?) and budget restraints when putting the schedule together.
A smart way of displaying the schedule, so you can show it to anyone involved in the project, stakeholders and clients included, is to create a visual timeline, such as a Gantt Chart, which will easily communicate and represent all of the moving parts. Fortunately, you don’t have to draw the bars by hand anymore, with modern computing Gantt Charts are essentially autonomous, only requiring people to input data in order to update them in real-time.
Bottom Line
Gantt charts and timelines in general are smart tools for visualising and sharing a schedule. However, a tool is only as good as the data you put inside. If you do not follow the principles of creating a proper project plan and schedule, even the most advanced fully-automated Gantt Chart will fail to make the project a success.
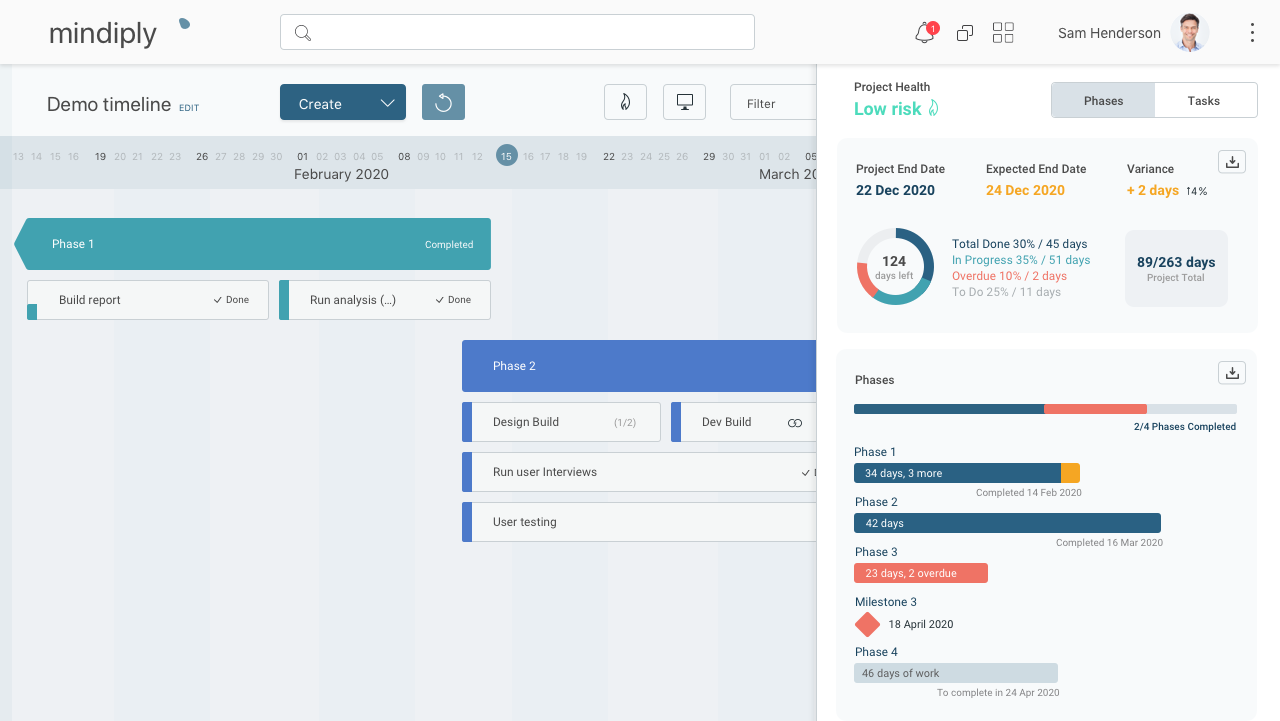
Looking for an online tool that will make your life as a Project Manager easier and engage your teammates and stakeholders? Try Mindiply Timeline, a new smart tool for project management. Sign up for a free 30-day trial!
Related articles


Want to see Mindiply timeline in action? Start a 30-day free trial today