
How to read a project timeline in Mindiply Timeline
Paolo Bongiovanni6 Jul 23
This article explains how to read a project timeline in Mindiply Timeline. After defining what a project timeline is, we describe what the various shapes and lines in it represent. By the end of the article you will be able to look at a Mindiply project timeline and answer three questions about the project it represents: when, how and who.
Definitions
A timeline is a display of a list of events in chronological order.
A project timeline is a visual representation of the work needed to deliver the outcomes of a project. The work is organised in a hierarchy called a work breakdown structure.
A Mindiply project timeline is our visual representation of a project timeline. The Mindiply project timeline answers three fundamental questions about a project:
- When does the project end?
- How is the project structured?
- Who delivers the project?
Reading an example project timeline in Mindiply Timeline
The When
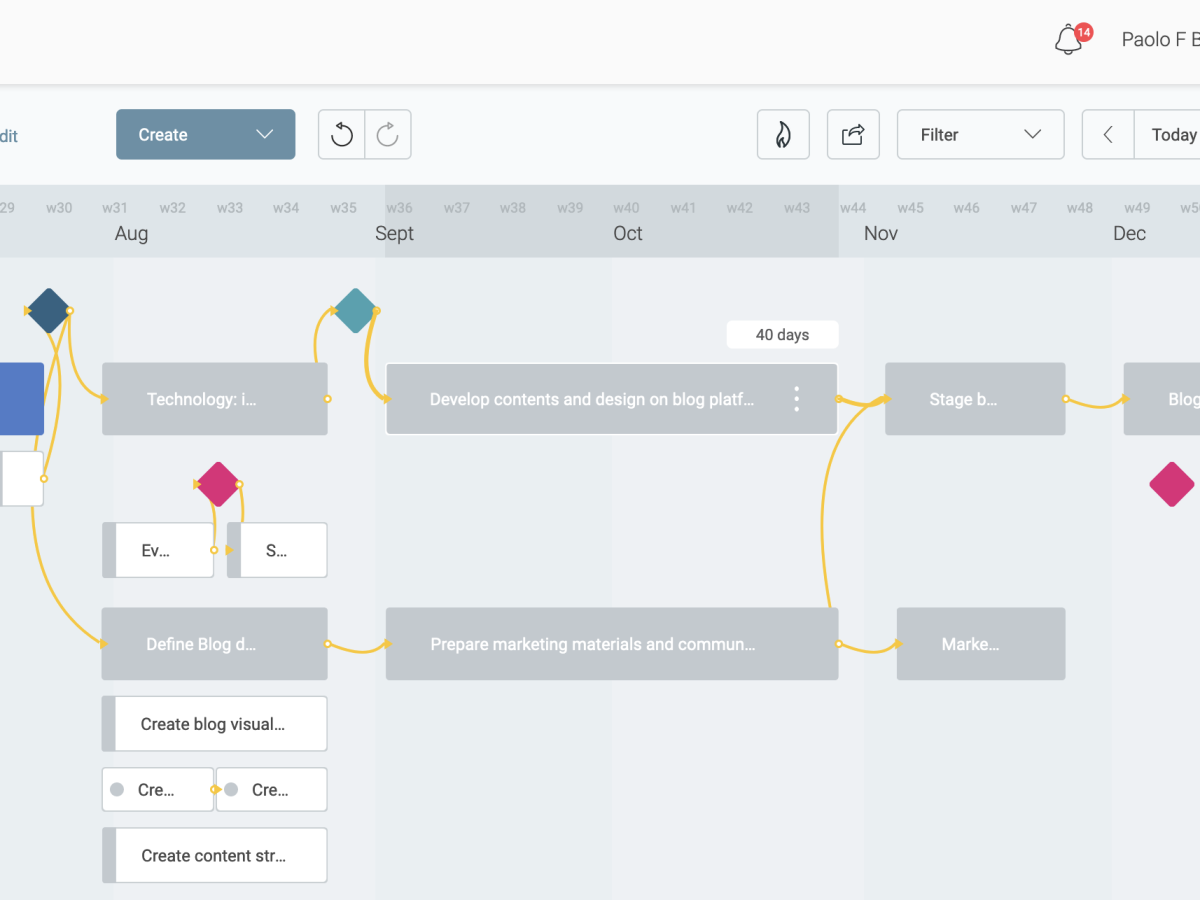
Let’s look at an example project timeline:

The horizontal axis represents time. In our example, the project schedule runs between July 2023 and the end of December 2023.
We’ve already found the answer to the first question: when does the project end?
To be more precise (and realistic), the question actually answered is: according to the current plan, when does the project end?
The how
There are three types of rectangles in the timeline. We call The fully coloured ones phases. Phases are the highest level of work breakdown in a project.

You break down phases into the second type of rectangles, the ones with white background and a coloured badge at the left edge. We call these rectangles activities.

An activity is usually delivered by a team of people.
Often, before an activity can start, the outcomes of a previous activity are needed. We see this kind of dependency made explicit with the yellow lines in the project timeline.

We call the yellow lines dependencies.
Activities can be further broken down into the third type of rectangles, the ones with a white background and a coloured dot. We call these rectangles sub-activities.

You use sub-activities when you can better organise an activity in separate streams of work.
You can also see some diamonds in the timeline. These are milestones, significant events in a project that are often communicated to those who care about the outcomes of the project - like customers and stakeholders.

Milestones often work as gates between phases. Before a milestone can be achieved, a certain phase needs to finish, and before a following phase can start the milestone needs to be achieved. Our example project timeline illustrates this with all the yellow lines coming to and going from the milestone diamonds.
All the elements you just read about and how they are organised and related to each other answers the second question about the project - how is the project carried out?
The who
So, who is doing the project? To answer that question you need to dig a bit deeper in the timeline. Let’s zoom into the start of our example project.

Each rectangle and diamond contain additional information that can be accessed by clicking on it. Looking into the first activity “Creative workshop - what could…” you see:

You can now see the faces of the persons who are performing the tasks of the creative workshop activity.
But what if you want to see all the people involved in the project? For that you want to see the overall details of the project and the screen that contains the information is the following:

You now have the answer to the third question - who is carrying out the project.
About the when, part two
If we go back a moment to the details of the creative workshop activity

You may notice that there is a section called tasks. Tasks are actual to-dos that team members carry out. The progress percentage to the left of a task tells you what its current status is.
When all the tasks of an activity are set to done, the colour of the bar turns turquoise. We achieved the outcomes of the activity!

The completion rate of tasks is the main mechanism in a Mindiply project timeline to monitor the progress of the entire project. Phases stay blue until all the tasks in the activities and sub-activities it is made of are completed.
You will see a red border around an activity if it was meant to be finished, according to its schedule, but there are still tasks in its hierarchy that are not completed. A red border means that you and the team may need to take some action to address the situation.
You can also see grey rectangles. These are phases, activities and sub-activities that are scheduled to start in the future.
In summary, the colours of the rectangles in a project timeline are:
- Turquoise: phases, activities and sub-activities that are completed
- Blue: phases, activities and sub-activities that you and your team are working on at the present time
- Gray: activities and sub-activities that are scheduled in the future
- Red border: phases, activities and sub-activities that should have completed by now, but have one or more tasks not completed within their hierarchy.
When you see everything turquoise:

you have successfully completed the project. Hurrah!
Related articles


Want to see Mindiply timeline in action? Start a 30-day free trial today